Visualizing Library Data
Karen A. Coombs
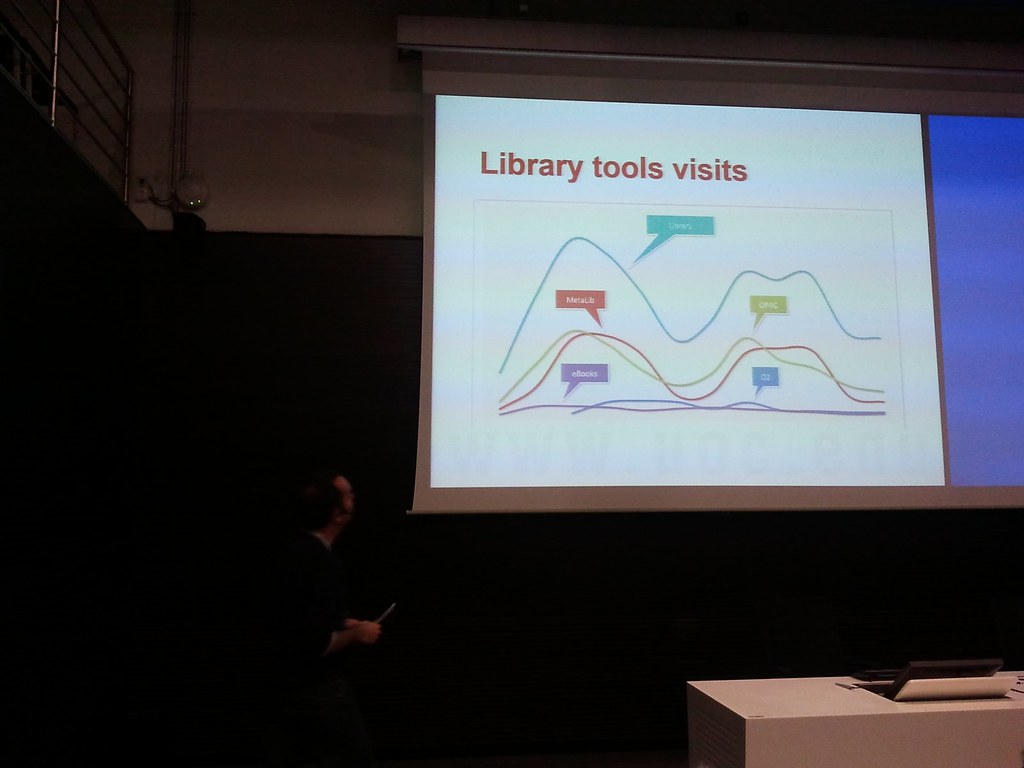
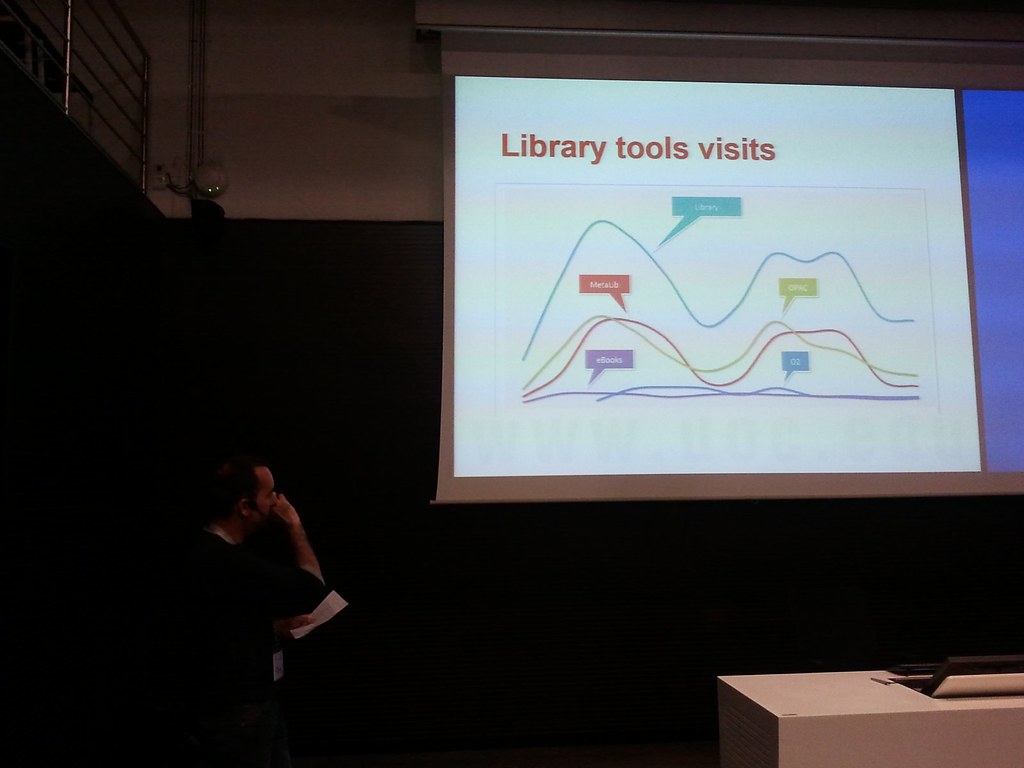
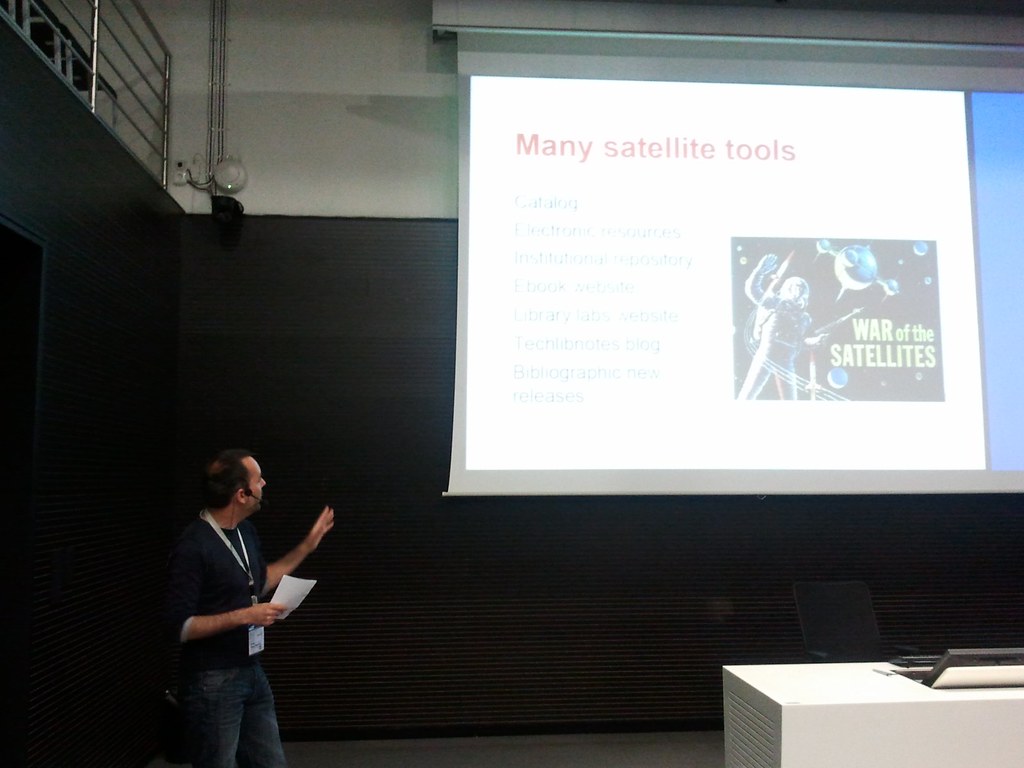
Visualizations can be powerful tools for sharing information with libraries users and for providing a clear picture with data to enable libraries to make decisions. Map mashups, tag clouds and timelines can be used to show information to user in new ways and help them locate materials to meet their needs. QR codes can help link users to materials libraries have in their collections. Charts and graphs can be used to help analyze library collections and holdings and compare them to other libraries. This session will show prototypes which combine tools like Google Chart API, Protovis and Simile Widgets with data from WorldCat, WorldCat Registry, Classify, Terminology Services, and Dewey.info to create vivid illustrations in library user interfaces and administration tools.
Attached files
elag20011_Coombs (31,07 MB)
elag2011_Coombs.m4v (29,43 MB)

visualizing_library_data (989,26 kB)